Tag: elasticsearch

  • GraphDB Connectors with Elasticsearch: Semantic Search Made Powerful

    GraphDB Connectors with Elasticsearch: Semantic Search Made Powerful

    GraphDB connectors allow you to leverage Elasticsearch’s full-text search capabilities for enhanced semantic search. In this guide, we’ll configure a GraphDB connector for Elasticsearch, execute SPARQL queries, and demonstrate debugging techniques to ensure seamless integration.

    Pre-requisites

    Before diving into the setup, ensure the following are in place:

    GrapghDB Locations And Repo configuration screenshot
    1. GraphDB Installation: Ensure you have an installed instance of GraphDB (Enterprise edition is required for connectors).
    2. Elasticsearch Installation: Install and configure Elasticsearch with the following:
      • Port 9300 must be open and running (configured in /config/elasticsearch.yml or through Puppet/Chef).
      • If using Vagrant, ensure ports 9200, 9300, and 12055 are forwarded to your host.

    Step 1: Prepare GraphDB

    1. Set up your GraphDB instance.
    2. Specify your repository and write data to it.

    Step 2: Create Elasticsearch Connector

    To create a connector, follow these steps:

    1. Navigate to the SPARQL tab in GraphDB.

    2. Insert the following query and click Run:

      SPARQL Query:

      PREFIX : <http://www.ontotext.com/connectors/elasticsearch#>
      PREFIX inst: <http://www.ontotext.com/instance/>
      
      INSERT DATA {
        inst:my_index :createConnector '''
        {
          "elasticsearchCluster": "vagrant",
          "elasticsearchNode": "localhost:9300",
          "types": ["http://www.ontotext.com/example/wine#Wine"],
          "fields": [
            {"fieldName": "grape", "propertyChain": ["http://www.ontotext.com/example/wine#hasGrape"]},
            {"fieldName": "sugar", "propertyChain": ["http://www.ontotext.com/example/wine#hasSugar"], "orderBy": true},
            {"fieldName": "year", "propertyChain": ["http://www.ontotext.com/example/wine#hasYear"]}
          ]
        }
        ''' .
      }
      

      3. Confirm the new connector in Elasticsearch by verifying the creation of my_index (it will be empty initially).

      4. Debug the connector using these queries to check for connectivity and status:

      List Connectors:

      PREFIX : <http://www.ontotext.com/connectors/elasticsearch#>
      
      SELECT ?cntUri ?cntStr {
        ?cntUri :listConnectors ?cntStr .
      }

      Check Connector Status:

      PREFIX : <http://www.ontotext.com/connectors/elasticsearch#>
      
      SELECT ?cntUri ?cntStatus {
        ?cntUri :connectorStatus ?cntStatus .
      }

      Step 3: Insert Data into GraphDB

      Ensure your connector listens for data changes by inserting, updating, or syncing data with the corresponding Elasticsearch copy. Use the following data insertion example:

      SPARQL Data Insertion:

      @prefix rdf: <http://www.w3.org/1999/02/22-rdf-syntax-ns#>
      @prefix rdfs: <http://www.w3.org/2000/01/rdf-schema#>
      @prefix xsd: <http://www.w3.org/2001/XMLSchema#>
      @prefix : <http://www.ontotext.com/example/wine#>
      
      :RedWine rdfs:subClassOf :Wine .
      :WhiteWine rdfs:subClassOf :Wine .
      :RoseWine rdfs:subClassOf :Wine .
      
      :Merlo rdf:type :Grape ; rdfs:label "Merlo" .
      :CabernetSauvignon rdf:type :Grape ; rdfs:label "Cabernet Sauvignon" .
      :CabernetFranc rdf:type :Grape ; rdfs:label "Cabernet Franc" .
      :PinotNoir rdf:type :Grape ; rdfs:label "Pinot Noir" .
      
      :Yoyowine rdf:type :RedWine ;
        :madeFromGrape :CabernetSauvignon ;
        :hasSugar "dry" ;
        :hasYear "2013"^^xsd:integer . 

      Debugging Tips

      1. Use the SPARQL queries above to validate your setup.
      2. Ensure Elasticsearch logs show successful connector interactions.
      3. Check that my_index in Elasticsearch reflects the inserted data from GraphDB.

      Conclusion

      Configuring GraphDB connectors with Elasticsearch allows you to combine semantic search sophistication with Elasticsearch’s robust full-text search capabilities. This integration unlocks advanced search and analytics for your data. Use the steps and SPARQL queries above to ensure a seamless setup.

      For more insights, explore the GraphDB documentation and Elasticsearch official guide.

    1. Elasticsearch Ransomware: A Wake-Up Call for Admins

      Elasticsearch Ransomware: A Wake-Up Call for Admins

      By now, we’ve all seen this coming. With MongoDB falling victim to ransomware attacks, other NoSQL technologies like Elasticsearch were bound to follow. The alarming truth? Many Elasticsearch clusters are still open to the internet, vulnerable to attackers exploiting weak security practices, default configurations, and exposed ports.

      This guide covers essential steps to protect your Elasticsearch cluster from becoming the next target.

      TL;DR: Essential Security Measures

      1. Use X-Pack Security: If possible, implement Elastic’s built-in security features.
      2. Do Not Expose Your Cluster to the Internet: Keep your cluster isolated from public access.
      3. Avoid Default Configurations: Change default ports and settings to reduce predictability.
      4. Disable HTTP Access: If not required, disable HTTP access to limit attack vectors.
      5. Use a Firewall or Reverse Proxy: Implement security layers like Nginx, VPN, or firewalls (example Nginx config).
      6. Disable Scripts: Turn off scripting unless absolutely necessary.
      7. Regular Backups: Use tools like Curator to back up your data regularly.

      The Ransomware Playbook

      Ransomware attackers are targeting Elasticsearch clusters, wiping out data, and leaving ransom notes like this:

      “Send 0.2 BTC (bitcoin) to this wallet xxxxxxxxxxxxxx234235xxxxxx343xxxx if you want to recover your database! Send your service IP to this email after payment: xxxxxxx@xxxxxxx.org.”

      Their method is straightforward:

      • Target: Internet-facing clusters with poor configurations.
      • Exploit: Clusters with no authentication, default ports, and exposed HTTP.
      • Action: Wipe the cluster clean and demand payment.

      Why Are Clusters Vulnerable?

      Many Elasticsearch admins overlook basic security practices, leaving clusters open to the internet without authentication or firewall protection. Even clusters with security measures are often left with weak passwords, exposed ports, and unnecessary HTTP enabled.

      The lesson? Default settings are dangerous. Attackers are actively scanning for such vulnerabilities.

      How to Protect Your Elasticsearch Cluster

      1. Use Elastic’s X-Pack Security

      X-Pack, Elastic’s security plugin, provides out-of-the-box protection with features like:

      • User authentication and role-based access control (RBAC).
      • Encrypted communication.
      • Audit logging.

      If you’re using Elastic Cloud, these protections are enabled by default.

      2. Avoid Exposing Your Cluster to the Internet

      Isolate your cluster from public access:

      • Use private IPs or a Virtual Private Network (VPN).
      • Block all inbound traffic except trusted sources.

      3. Change Default Ports and Configurations

      Avoid predictability by changing Elasticsearch’s default port (9200) and disabling unnecessary features like HTTP if they aren’t required.

      4. Implement Firewalls and Reverse Proxies

      Add security layers between your cluster and potential attackers:

      • Use a reverse proxy like Nginx or Apache.
      • Configure firewall rules to allow only trusted IPs.

      5. Disable Scripting

      Unless absolutely necessary, disable Elasticsearch’s scripting capabilities to minimize attack surfaces. You can disable scripts in the elasticsearch.yml configuration file:

      script.allowed_types: none

      6. Regular Backups with Curator

      Data loss is inevitable without backups. Use tools like Elasticsearch Curator to regularly back up your data. Store snapshots in a secure, offsite location.

      Additional Resources

      Closing Thoughts

      Elasticsearch ransomware attacks are a stark reminder of the importance of proactive security measures. Whether you’re hosting your cluster on Elastic Cloud or self-managing it, adopting the security best practices outlined here will safeguard your data from malicious actors.

      Remember:

      • Change default configurations.
      • Isolate your cluster from the internet.
      • Regularly back up your data.

      If your Elasticsearch cluster is unprotected, the time to act is now—don’t wait until it’s too late.

    2. Cleaning Elasticsearch Data Before Indexing

      Cleaning Elasticsearch Data Before Indexing

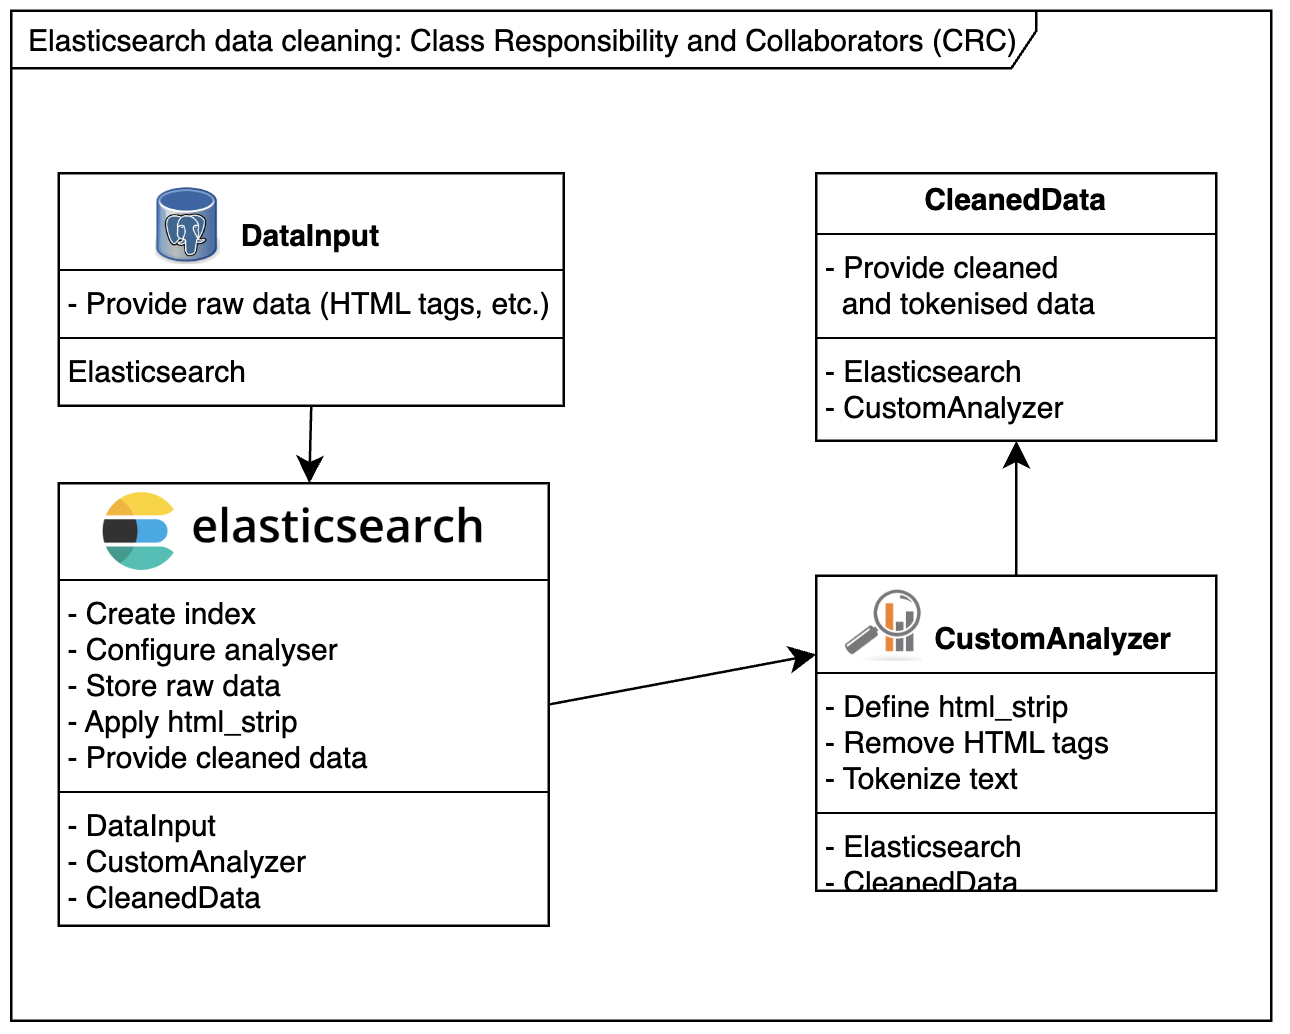
      When dealing with Elasticsearch, sometimes you can’t control the format of incoming data. For instance, HTML tags may slip into your Elasticsearch index, creating unintended or unpredictable search results.

      Example Scenario:
      Consider the following HTML snippet indexed into Elasticsearch:

      <a href="http://somedomain.com">website</a>

      A search for somedomain might match the above link 🫣, but users rarely expect that. To avoid such issues, use a custom analyser to clean the data before indexing. This guide shows you how to clean and debug Elasticsearch data effectively.

      Step 1: Create a New Index with HTML Strip Mapping

      Create a new index with a custom analyzer that uses the html_strip character filter to clean your data.

      PUT Request:

      PUT /html_poc_v3
      {
        "settings": {
          "analysis": {
            "analyzer": {
              "my_html_analyzer": {
                "type": "custom",
                "tokenizer": "standard",
                "char_filter": ["html_strip"]
              }
            }
          }
        },
        "mappings": {
          "html_poc_type": {
            "properties": {
              "body": {
                "type": "string",
                "analyzer": "my_html_analyzer"
              },
              "description": {
                "type": "string",
                "analyzer": "standard"
              },
              "title": {
                "type": "string",
                "analyzer": "my_html_analyzer"
              },
              "urlTitle": {
                "type": "string"
              }
            }
          }
        }
      }

      Step 2: Post Sample Data

      Add some sample data to the newly created index to test the analyzer.

      POST Request:

      POST /html_poc_v3/html_poc_type/02
      {
        "description": "Description <p>Some déjà vu <a href=\"http://somedomain.com\">website</a>",
        "title": "Title <p>Some déjà vu <a href=\"http://somedomain.com\">website</a>",
        "body": "Body <p>Some déjà vu <a href=\"http://somedomain.com\">website</a>"
      } 

      Step 3: Retrieve Indexed Data

      To inspect the cleaned data, use the _search API with custom script fields to bypass the _source field and retrieve the actual indexed tokens.

      GET Request:

      GET /html_poc_v3/html_poc_type/_search?pretty=true
      {
        "query": {
          "match_all": {}
        },
        "script_fields": {
          "title": {
            "script": "doc[field].values",
            "params": {
              "field": "title"
            }
          },
          "description": {
            "script": "doc[field].values",
            "params": {
              "field": "description"
            }
          },
          "body": {
            "script": "doc[field].values",
            "params": {
              "field": "body"
            }
          }
        }
      }

      Example Response

      Here’s an example response showing the cleaned tokens for title, description, and body fields:

      {
        "took": 2,
        "timed_out": false,
        "_shards": {
          "total": 5,
          "successful": 5,
          "failed": 0
        },
        "hits": {
          "total": 1,
          "max_score": 1,
          "hits": [
            {
              "_index": "html_poc_v3",
              "_type": "html_poc_type",
              "_id": "02",
              "_score": 1,
              "fields": {
                "title": [
                  "Some",
                  "Title",
                  "déjà",
                  "vu",
                  "website"
                ],
                "body": [
                  "Body",
                  "Some",
                  "déjà",
                  "vu",
                  "website"
                ],
                "description": [
                  "a",
                  "agrave",
                  "d",
                  "description",
                  "eacute",
                  "href",
                  "http",
                  "j",
                  "p",
                  "some",
                  "somedomain.com",
                  "vu",
                  "website"
                ]
              }
            }
          ]
        }
      }

      Further Cleaning Elasticsearch Data References

      For additional resources, explore the following links:


      Conclusion

      Cleaning Elasticsearch data using custom analyzers and filters like html_strip ensures accurate and predictable indexing. By following the steps in this guide, you can avoid unwanted behavior and maintain clean, searchable data. Use the provided resources to further enhance your Elasticsearch workflow.

    3. The Case of Missing Elasticsearch Logs: A Midnight Mystery

      The Case of Missing Elasticsearch Logs: A Midnight Mystery

      While debugging my Elasticsearch instance, I noticed a curious issue: logs would vanish consistently at midnight. No logs appeared between 23:40:00 and 00:00:05, leaving an unexplained gap. This guide walks through the debugging process, root cause identification, and a simple fix.

      Initial Investigation: Where Did the Logs Go?

      At first glance, the following possibilities seemed likely:

      1. Log Rotation: Elasticsearch rotates its logs at midnight. Could this process be causing the missing lines?
      2. Marvel Indices: Marvel creates daily indices at midnight. Could this interfere with log generation?

      Neither explained the issue upon closer inspection, so I dug deeper.

      The Real Culprit: Log4j and DailyRollingFileAppender

      The issue turned out to be related to Log4j. Elasticsearch uses Log4j for logging, but instead of a traditional log4j.properties file, it employs a translated YAML configuration. After reviewing the logging configuration, I found the culprit: DailyRollingFileAppender.

      What’s Wrong with DailyRollingFileAppender?

      The DailyRollingFileAppender class extends Log4j’s FileAppender but introduces a major flaw—it synchronizes file rolling at user-defined intervals, which can cause:

      • Data Loss: Logs might not be written during the rolling process.
      • Synchronization Issues: Overlap between log files leads to missing data.

      This behavior is well-documented in the Apache DailyRollingFileAppender documentation.

      Root Cause: Why Were Logs Missing?

      The missing logs were a direct result of using DailyRollingFileAppender, which failed to properly handle log rotation at midnight. This caused gaps in logging during the critical period when the file was being rolled over.

      The Fix: Switch to RollingFileAppender

      To resolve this, I replaced DailyRollingFileAppender with RollingFileAppender, which rolls logs based on file size rather than a specific time. This eliminates the synchronization issues associated with the daily rolling behavior.

      Updated YAML Configuration

      Here’s how I updated the configuration:

      file:
        type: rollingfile
        file: ${path.logs}/${cluster.name}.log
        maxFileSize: 100MB
        maxBackupIndex: 10
        layout:
          type: pattern
          conversionPattern: "[%d{ISO8601}][%-5p][%-25c] %m%n" 

      Key Changes:

      • Type: Changed from dailyRollingFile to rollingFile.
      • File Size Limit: Set maxFileSize to 100MB.
      • Backup: Retain up to 10 backup log files.
      • Removed Date Pattern: Eliminated the problematic datePattern field used by DailyRollingFileAppender.

      Happy Ending: Logs Restored

      After implementing the fix, Elasticsearch logs stopped disappearing. Interestingly, further investigation revealed that the midnight log gap was also related to Marvel indices transitioning into a new day. This caused brief latency as new indices were created for shards and replicas.

      Lessons Learned

      1. Understand Your Tools: Familiarity with Log4j’s appenders helped identify the issue quickly.
      2. Avoid Deprecated Features: DailyRollingFileAppender is prone to issues—switch to RollingFileAppender for modern setups.
      3. Analyze Related Systems: The Marvel index creation provided additional context for the midnight timing.

      Conclusion

      Debugging missing Elasticsearch logs required diving into the logging configuration and understanding how appenders handle file rolling. By switching to RollingFileAppender, I resolved the synchronisation issues and restored the missing logs.

      If you’re experiencing similar issues, check your logging configuration and avoid using DailyRollingFileAppender in favor of RollingFileAppender. This can save hours of debugging in the future.

      For more insights, explore Log4j Appender Documentation.

      Also, to learn how to clean data coming into Elasticsearch see Cleaning Elasticsearch Data Before Indexing.