Tag: configuration

  • How to Configure Jest for TypeScript in React or NodeJS Projects

    How to Configure Jest for TypeScript in React or NodeJS Projects

    Setting up Jest for TypeScript testing in React and NodeJS can streamline your development workflow and ensure high-quality code. This guide provides an opinionated, step-by-step process for configuring Jest with TypeScript support, whether you’re working on new or existing projects.

    1. Install Jest and Its Friends (Dependencies)

    Start by installing the necessary Jest packages along with TypeScript support:

    # Using Yarn
    yarn add --dev jest ts-jest @types/jest
    
    # Or using npm
    npm install --save-dev jest ts-jest @types/jest
    • ts-jest: A TypeScript preprocessor that lets Jest handle .ts and .tsx (TypeScript files).
    • @types/jest: Provides type definitions for Jest in TypeScript.

    2. Configure Jest with the Preprocessor

    Generate a basic Jest configuration using ts-jest:

    npx ts-jest config:init

    This command generates a jest.config.js file with the following contents:

    module.exports = {
      preset: 'ts-jest',
      testEnvironment: 'node',
    };

    3. Customize Your Jest Configuration (Optional)

    For advanced setups, you can extend your configuration to include code coverage and improved testing workflows:

    module.exports = {
      roots: ['<rootDir>/src'],
      preset: 'ts-jest',
      testEnvironment: 'node',
      coverageDirectory: 'coverage',
      verbose: true,
      collectCoverage: true,
      coverageThreshold: {
        global: {
          branches: 90,
          functions: 95,
          lines: 95,
          statements: 90,
        },
      },
      collectCoverageFrom: ['**/*.{ts,tsx}'],
      coveragePathIgnorePatterns: ['/node_modules/'],
      coverageReporters: ['json', 'lcov', 'text', 'clover'],
    }; 

    This configuration adds:

    • Code coverage thresholds to ensure high-quality tests.
    • A custom coverage directory.
    • Inclusion of TypeScript, TSX, and JSX files.

    For more advanced configurations, check the official Jest documentation.

    4. Add Jest Test Scripts to package.json

    Add custom scripts for testing workflows in your package.json file:

    {
      "scripts": {
        "test": "jest --coverage",
        "test:watch": "jest --watchAll",
        "test:nocoverage": "jest --watchAll --no-coverage"
      }
    }

    These scripts provide:

    • test: Runs all tests with coverage reports.
    • test:watch: Watches for changes and re-runs tests automatically.
    • test:nocoverage: Faster test runs without generating coverage reports.

    Congratulations if you got this far. This is a one-off set-up; you would rip the benefits in days to come. Follow on to test your Jest configuration for testing your Typescript React or NodeJs project.

    5. Verify the Setup with a Simple Test

    Create a simple function and its corresponding test file to confirm everything is configured correctly.

    Function (sum.ts):

    const sum = (a: number, b: number): number => a + b;
    export default sum;

    Test (sum.test.ts):

    import sum from './sum';
    
    describe('Addition function', () => {
      test('adds 1 + 2 to equal 3', () => {
        expect(sum(1, 2)).toBe(3);
      });
    });

    Run the test:

    yarn test

    6. Advanced Testing Workflow with Coverage Reports

    After running your tests, generate coverage reports for better visibility into untested areas of your codebase.

    Commands

    yarn test               # Runs tests with coverage
    yarn test:watch         # Continuously watches and runs tests
    yarn test:watch:nocoverage  # Faster feedback without coverage
    yarn global add serve   # Install `serve` to view reports
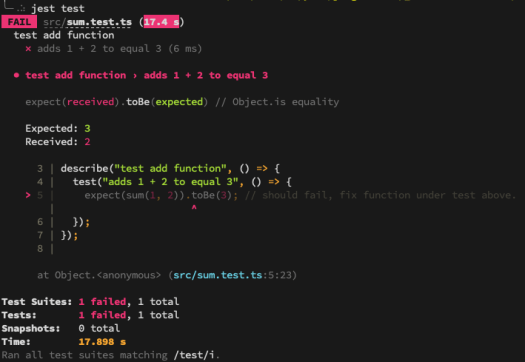
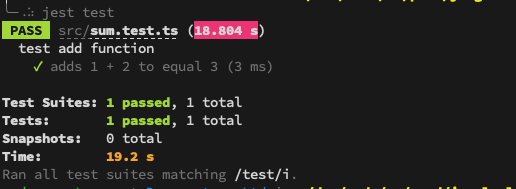
    yarn view:coverage      # Open the coverage reports as a static site 

    Example Test Outputs

    When running yarn test, you may see:

    Failing Test Example:

    yarn test Example console output with failing test.

    Passing Test Example

    yarn test Example console output with passing test.

    Now, fix any failing tests, and re-run the commands until all tests pass successfully.

    Why This Setup is Worth It

    This one-time Jest configuration significantly speeds up your TypeScript testing workflow. With proper coverage thresholds, easy-to-run scripts, and a reliable test runner like Jest, you’ll save time while improving your project’s overall quality.

    If you would like additional guidance, please take a look at the official Jest configuration guide.

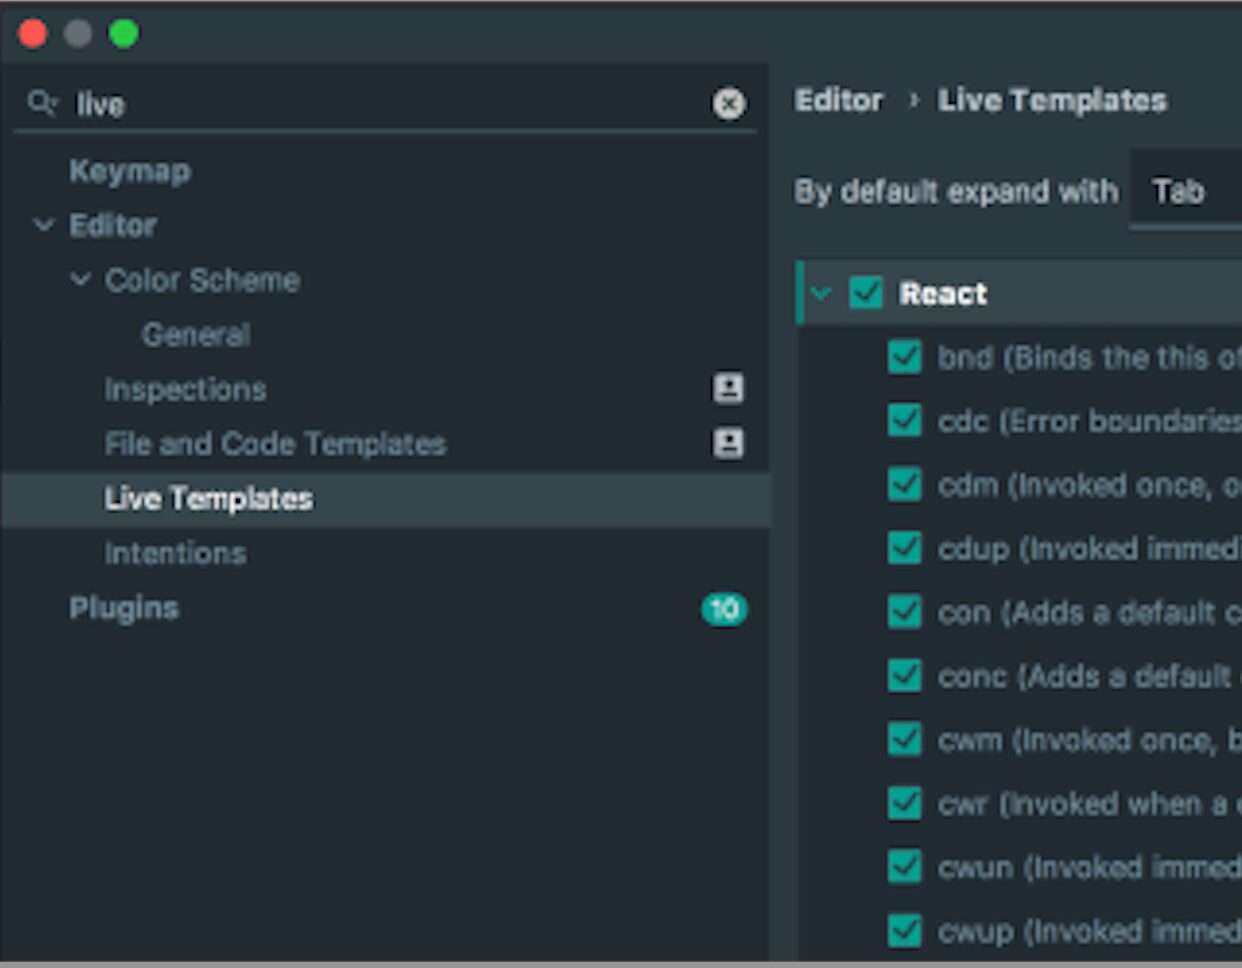
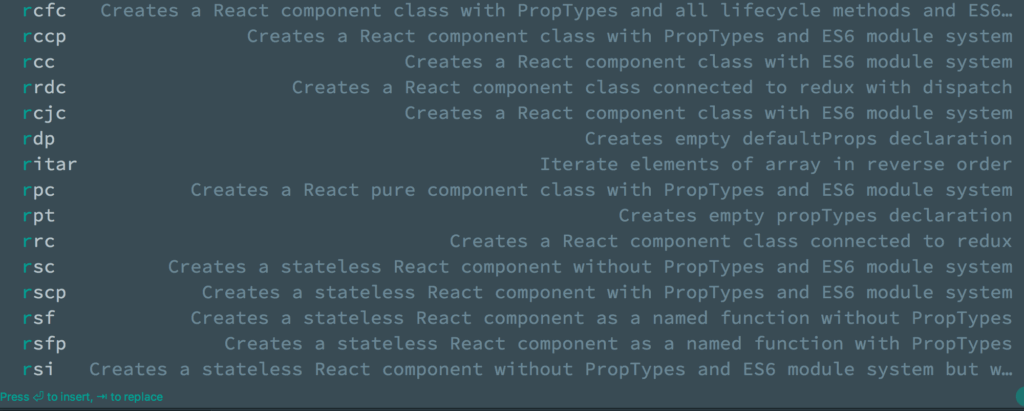
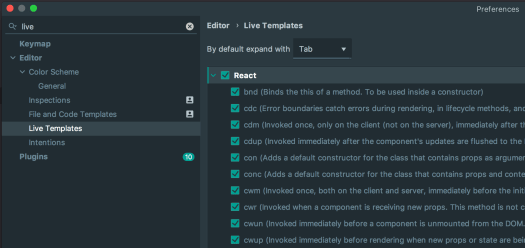
    Furthermore, you can configure your IDE to generate boilerplate code snippets using this guide: React Code Snippet Generators with IntelliJ Idea

  • Boosting React Development with IntelliJ IDEA Code Snippets

    Boosting React Development with IntelliJ IDEA Code Snippets

    If you’re a fan of automation (and who isn’t?), IntelliJ IDEA’s code snippets are a game-changer for React development. As a Java developer diving into React, I’ve found these snippets invaluable for reducing typos, boilerplate, and the dreaded RSI (Repetitive Strain Injury). This guide walks you through generating React components using IntelliJ IDEA’s live templates, saving you time and effort.

    How to Generate Snippets in IntelliJ IDEA

    Before we go any further here is how to generate code snippet in IntelliJ Idea

    •  Simply type abbreviation name of the required snippet in the editor in the target file and press 
    • You can further narow the list suggestions by IntelliJ Idea by typing more characters of your abbrevation.

    Example: shortcuts to create snippets on Intellij Idea on a Mac:

    React Code Snippets Generator IntelliJ Idea
    1. Type ​`​rccp` in your editor
    2. Then press  to generate.

    Note:

    • Component name would be taken from the file name, example “ManageCoursePage.js”
    • For those on Visual Studio Code IDE the Code generation for React can be achieved with the Typescript React Code Snippet Extention

    React Code Snippet Examples

    1. React Component Class with PropTypes

    Abbreviation: rcp
    Steps:

    1. Type rcp in the editor.
    2. Press Tab to generate the snippet.

    Generated Snippet:

    import React, { Component } from 'react';
    import PropTypes from 'prop-types';
    
    class ManageCoursePage extends Component {
      render() {
        return <div>{/* Your code here */}</div>;
      }
    }
    
    ManageCoursePage.propTypes = {};
    export default ManageCoursePage; 

    2. React Component Class with ES6 Module System

    Abbreviation: rcc
    Steps:

    1. Type rcc in the editor.
    2. Press Tab to generate the snippet.

    Generated Snippet:

     import React, { Component } from 'react';
    
    class ManageCoursePage extends Component {
      render() {
        return <div>{/* Your code here */}</div>;
      }
    }
    
    export default ManageCoursePage;

    3. React Component Class Connected to Redux with Dispatch

    Abbreviation: rdc
    Steps:

    1. Type rdc in the editor.
    2. Press Tab to generate the snippet.

    Generated Snippet:

    import React, { Component } from 'react';
    import { connect } from 'react-redux';
    
    function mapStateToProps(state) {
      return {};
    }
    
    function mapDispatchToProps(dispatch) {
      return {};
    }
    
    class ManageCoursePage extends Component {
      render() {
        return <div>{/* Your code here */}</div>;
      }
    }
    
    export default connect(mapStateToProps, mapDispatchToProps)(ManageCoursePage); 

    4. React Component Class with PropTypes and Lifecycle Methods

    Abbreviation: rcfc
    Steps:

    1. Type rcfc in the editor.
    2. Press Tab to generate the snippet.

    Generated Snippet:

    import React, { Component } from 'react';
    import PropTypes from 'prop-types';
    
    class ManageCoursePage extends Component {
      constructor(props) {
        super(props);
      }
    
      componentWillMount() {}
    
      componentDidMount() {}
    
      componentWillReceiveProps(nextProps) {}
    
      shouldComponentUpdate(nextProps, nextState) {
        return true;
      }
    
      componentWillUpdate(nextProps, nextState) {}
    
      componentDidUpdate(prevProps, prevState) {}
    
      componentWillUnmount() {}
    
      render() {
        return <div>{/* Your code here */}</div>;
      }
    }
    
    ManageCoursePage.propTypes = {};
    export default ManageCoursePage; 

    Customising IntelliJ Snippets

    React Code Snippets Generator IntelliJ Idea Manage
    IntelliJ idea live template view

    To create or modify snippets in IntelliJ IDEA:

    1. Open Preferences > Editor > Live Templates.
    2. Add new templates or tweak existing ones to match your development style.

    These templates can also be shared across teams to maintain consistency and reduce onboarding time.

    Congratulations! You’ve successfully set up Jest for TypeScript testing in React and NodeJS and integrated IntelliJ IDEA to 10x your workflow. Now! No excuses not to follow a test-driven approach (TDD) and automated testing, which will eventually lead to faster development and more confidence in shipping more frequently

    Conclusion

    IntelliJ IDEA snippets are a fantastic way to save time and reduce errors when working with React. Whether you’re generating PropTypes, lifecycle methods, or Redux-connected components, these templates make development faster and less repetitive. Explore IntelliJ’s live template feature to customise your workflow and share these snippets with your team for maximum efficiency.

    For more automation tips, check out IntelliJ IDEA’s documentation on live templates.

    For more resources

  • Upgrading from JUnit 4 to JUnit 5 in Spring Boot Applications

    Upgrading from JUnit 4 to JUnit 5 in Spring Boot Applications

    Migrating from JUnit 4 to JUnit 5 (Jupiter) can feel daunting, especially if your project is built on older versions of Spring Boot. This guide breaks down the process step-by-step, helping you navigate dependency adjustments, IDE tweaks, and annotation replacements.

    Prerequisite: Spring Boot Compatibility

    Before starting, note that the SpringExtension required for JUnit 5 is only available starting from Spring 5. Unfortunately, spring-boot-starter-test 1.5.x is based on Spring 4, meaning JUnit 5 isn’t natively supported until you upgrade to Spring Boot 2.x or later.

    For more details, check:

    Step 1: Adjust Dependencies

    To use JUnit 5 in a Spring Boot project, you’ll need to exclude the default JUnit 4 dependency and explicitly add JUnit 5 dependencies.

    Current Dependency Configuration (JUnit 4)

    <dependency>
        <groupId>org.springframework.boot</groupId>
        <artifactId>spring-boot-starter-test</artifactId>
        <scope>test</scope>
    </dependency> 

    Updated Dependency Configuration (JUnit 5)

    Exclude JUnit 4 and add JUnit 5 dependencies:

    <dependency>
        <groupId>org.springframework.boot</groupId>
        <artifactId>spring-boot-starter-test</artifactId>
        <scope>test</scope>
        <exclusions>
            <exclusion>
                <groupId>junit</groupId>
                <artifactId>junit</artifactId>
            </exclusion>
        </exclusions>
    </dependency>
    <dependency>
        <groupId>org.junit.jupiter</groupId>
        <artifactId>junit-jupiter</artifactId>
        <scope>test</scope>
    </dependency> 

    Step 2: Update Imports

    With JUnit 5, most of the imports and annotations from JUnit 4 have been replaced. Use your IDE to quickly update these references.

    Global Find and Replace:

    1. Replace Imports
      • import org.junit.Test
        • import org.junit.jupiter.api.Test
      • import org.junit.runner.RunWith
        • import org.junit.jupiter.api.extension.ExtendWith
      • import org.springframework.test.context.junit4.SpringRunner
        • import org.springframework.test.context.junit.jupiter.SpringExtension
    2. Replace Annotations
      • @RunWith(SpringRunner.class)
        • @ExtendWith(SpringExtension.class)

    Step 3: Replace Annotations in Test Classes

    After updating imports, your test classes need to use JUnit 5’s new annotations.

    Before (JUnit 4)

    import org.junit.Test;
    import org.junit.runner.RunWith;
    import org.springframework.test.context.junit4.SpringRunner;
    
    @RunWith(SpringRunner.class)
    public class ExampleTest {
        @Test
        public void shouldPass() {
            // test logic
        }
    } 

    After (JUnit 5)

    import org.junit.jupiter.api.Test;
    import org.junit.jupiter.api.extension.ExtendWith;
    import org.springframework.test.context.junit.jupiter.SpringExtension;
    
    @ExtendWith(SpringExtension.class)
    public class ExampleTest {
        @Test
        public void shouldPass() {
            // test logic
        }
    } 

    Step 4: Use IDE Features for Dependency Updates

    adding Junit5 to the classpath

    If you’re using IntelliJ IDEA or similar IDEs, enable dependency management features to simplify updating your pom.xml. Use the following snippets if you prefer manual configuration:

    <dependency>
        <groupId>org.junit.jupiter</groupId>
        <artifactId>junit-jupiter-api</artifactId>
        <scope>test</scope>
    </dependency> 

    Why Upgrade to JUnit 5?

    JUnit 5 offers several advantages over JUnit 4, including:

    • Better modularity: You can use only the features you need.
    • New annotations: More flexibility with @BeforeEach, @AfterEach, and others.
    • Parameter injection: Cleaner test code through parameterized tests.

    Conclusion

    Upgrading from JUnit 4 to JUnit 5 in Spring Boot applications ensures your project stays up-to-date with modern testing frameworks. For more customisation, you can explore the official JUnit 5 documentation.

    Let me know how the migration process goes, and happy testing!

  • TypeScript is Great, But Sometimes You Just Want Java

    TypeScript is Great, But Sometimes You Just Want Java

    TypeScript has become the de facto language for Angular development, and for good reason—it’s easy to learn, strongly typed, and less error-prone than JavaScript. But what if you prefer Java for its mature tooling, strong object-oriented features, and familiarity? Enter Angular2Boot—a framework built on Angular 2, GWT, and Spring Boot that lets you write Angular 2 apps in Java 8.

    This guide walks you through setting up and running an Angular 2 app in Java 8 using Angular2Boot.

    Why Angular2Boot?

    Angular2Boot bridges the gap between modern frontend development and Java’s robust backend ecosystem. It’s particularly useful for smaller applications where splitting the app into multiple tiers (WebClient, Service, Backend REST API) might feel like overkill.

    Key Benefits

    1. Stronger Typing: Java provides even stronger type-checking compared to TypeScript.
    2. Mature Tooling: Java offers tried-and-tested tools and IDEs for streamlined development.
    3. Simplified Deployment: Package everything into one Spring Boot jar for production-ready builds.
    4. Robustness: Java remains a go-to language for building scalable, enterprise-grade applications.

    Getting Started with Angular2Boot

    Step 1: Create the Project

    Generate an Angular and GWT app using Maven archetype:

    mvn archetype:generate 
      -DarchetypeGroupId=fr.lteconsulting 
      -DarchetypeArtifactId=angular2-gwt.archetype 
      -DarchetypeVersion=1.6 

    During the setup process, provide the following details:

    • Group ID: com.mosesmansaray.play
    • Artifact ID: angular-gwt-in-java8-example
    • Version: 1.0-SNAPSHOT
    • Package Name: com.mosesmansaray.play

    This will create a project scaffold with all the necessary dependencies and configurations.

    Step 2: Install Dependencies

    Build the project to install all required dependencies and produce an executable JAR file:

    mvn clean install

    The resulting JAR file will be located in your target folder:

    /angular-gwt-in-java8-example/target/angular-gwt-in-java8-example-1.0-SNAPSHOT.jar
    

    Step 3: Run the Application

    Run the fat JAR file to start your application:

    java -jar target/angular-gwt-in-java8-example-1.0-SNAPSHOT.jar
    

    Step 4: Development with Live Reload

    During development, you can enable live reload for both backend and frontend:

    Backend:

    mvn spring-boot:run

    Frontend:

    mvn gwt:run-codeserver

    This ensures a seamless development workflow with real-time updates.


    Resources for Further Exploration

    1. Library Source Code: Explore the codebase.
    2. GWT con 2016 Talk: Watch here
    3. Speaker Deck Slides: A great overview of Angular2Boot.
    4. Code Demos:

    Conclusion

    Angular2Boot allows developers to harness the power of Angular 2 while benefiting from Java’s strong typing, mature tooling, and simplified deployment. Brilliant for when you’re prototyping or building enterprise-grade systems, Angular2Boot bridges the gap between modern frontend frameworks and Java’s backend ecosystem.

    Try it and experience the best of both worlds! Let me know what you think.

  • Elasticsearch Ransomware: A Wake-Up Call for Admins

    Elasticsearch Ransomware: A Wake-Up Call for Admins

    By now, we’ve all seen this coming. With MongoDB falling victim to ransomware attacks, other NoSQL technologies like Elasticsearch were bound to follow. The alarming truth? Many Elasticsearch clusters are still open to the internet, vulnerable to attackers exploiting weak security practices, default configurations, and exposed ports.

    This guide covers essential steps to protect your Elasticsearch cluster from becoming the next target.

    TL;DR: Essential Security Measures

    1. Use X-Pack Security: If possible, implement Elastic’s built-in security features.
    2. Do Not Expose Your Cluster to the Internet: Keep your cluster isolated from public access.
    3. Avoid Default Configurations: Change default ports and settings to reduce predictability.
    4. Disable HTTP Access: If not required, disable HTTP access to limit attack vectors.
    5. Use a Firewall or Reverse Proxy: Implement security layers like Nginx, VPN, or firewalls (example Nginx config).
    6. Disable Scripts: Turn off scripting unless absolutely necessary.
    7. Regular Backups: Use tools like Curator to back up your data regularly.

    The Ransomware Playbook

    Ransomware attackers are targeting Elasticsearch clusters, wiping out data, and leaving ransom notes like this:

    “Send 0.2 BTC (bitcoin) to this wallet xxxxxxxxxxxxxx234235xxxxxx343xxxx if you want to recover your database! Send your service IP to this email after payment: xxxxxxx@xxxxxxx.org.”

    Their method is straightforward:

    • Target: Internet-facing clusters with poor configurations.
    • Exploit: Clusters with no authentication, default ports, and exposed HTTP.
    • Action: Wipe the cluster clean and demand payment.

    Why Are Clusters Vulnerable?

    Many Elasticsearch admins overlook basic security practices, leaving clusters open to the internet without authentication or firewall protection. Even clusters with security measures are often left with weak passwords, exposed ports, and unnecessary HTTP enabled.

    The lesson? Default settings are dangerous. Attackers are actively scanning for such vulnerabilities.

    How to Protect Your Elasticsearch Cluster

    1. Use Elastic’s X-Pack Security

    X-Pack, Elastic’s security plugin, provides out-of-the-box protection with features like:

    • User authentication and role-based access control (RBAC).
    • Encrypted communication.
    • Audit logging.

    If you’re using Elastic Cloud, these protections are enabled by default.

    2. Avoid Exposing Your Cluster to the Internet

    Isolate your cluster from public access:

    • Use private IPs or a Virtual Private Network (VPN).
    • Block all inbound traffic except trusted sources.

    3. Change Default Ports and Configurations

    Avoid predictability by changing Elasticsearch’s default port (9200) and disabling unnecessary features like HTTP if they aren’t required.

    4. Implement Firewalls and Reverse Proxies

    Add security layers between your cluster and potential attackers:

    • Use a reverse proxy like Nginx or Apache.
    • Configure firewall rules to allow only trusted IPs.

    5. Disable Scripting

    Unless absolutely necessary, disable Elasticsearch’s scripting capabilities to minimize attack surfaces. You can disable scripts in the elasticsearch.yml configuration file:

    script.allowed_types: none

    6. Regular Backups with Curator

    Data loss is inevitable without backups. Use tools like Elasticsearch Curator to regularly back up your data. Store snapshots in a secure, offsite location.

    Additional Resources

    Closing Thoughts

    Elasticsearch ransomware attacks are a stark reminder of the importance of proactive security measures. Whether you’re hosting your cluster on Elastic Cloud or self-managing it, adopting the security best practices outlined here will safeguard your data from malicious actors.

    Remember:

    • Change default configurations.
    • Isolate your cluster from the internet.
    • Regularly back up your data.

    If your Elasticsearch cluster is unprotected, the time to act is now—don’t wait until it’s too late.

  • Cleaning Elasticsearch Data Before Indexing

    Cleaning Elasticsearch Data Before Indexing

    When dealing with Elasticsearch, sometimes you can’t control the format of incoming data. For instance, HTML tags may slip into your Elasticsearch index, creating unintended or unpredictable search results.

    Example Scenario:
    Consider the following HTML snippet indexed into Elasticsearch:

    <a href="http://somedomain.com">website</a>

    A search for somedomain might match the above link 🫣, but users rarely expect that. To avoid such issues, use a custom analyser to clean the data before indexing. This guide shows you how to clean and debug Elasticsearch data effectively.

    Step 1: Create a New Index with HTML Strip Mapping

    Create a new index with a custom analyzer that uses the html_strip character filter to clean your data.

    PUT Request:

    PUT /html_poc_v3
    {
      "settings": {
        "analysis": {
          "analyzer": {
            "my_html_analyzer": {
              "type": "custom",
              "tokenizer": "standard",
              "char_filter": ["html_strip"]
            }
          }
        }
      },
      "mappings": {
        "html_poc_type": {
          "properties": {
            "body": {
              "type": "string",
              "analyzer": "my_html_analyzer"
            },
            "description": {
              "type": "string",
              "analyzer": "standard"
            },
            "title": {
              "type": "string",
              "analyzer": "my_html_analyzer"
            },
            "urlTitle": {
              "type": "string"
            }
          }
        }
      }
    }

    Step 2: Post Sample Data

    Add some sample data to the newly created index to test the analyzer.

    POST Request:

    POST /html_poc_v3/html_poc_type/02
    {
      "description": "Description <p>Some déjà vu <a href=\"http://somedomain.com\">website</a>",
      "title": "Title <p>Some déjà vu <a href=\"http://somedomain.com\">website</a>",
      "body": "Body <p>Some déjà vu <a href=\"http://somedomain.com\">website</a>"
    } 

    Step 3: Retrieve Indexed Data

    To inspect the cleaned data, use the _search API with custom script fields to bypass the _source field and retrieve the actual indexed tokens.

    GET Request:

    GET /html_poc_v3/html_poc_type/_search?pretty=true
    {
      "query": {
        "match_all": {}
      },
      "script_fields": {
        "title": {
          "script": "doc[field].values",
          "params": {
            "field": "title"
          }
        },
        "description": {
          "script": "doc[field].values",
          "params": {
            "field": "description"
          }
        },
        "body": {
          "script": "doc[field].values",
          "params": {
            "field": "body"
          }
        }
      }
    }

    Example Response

    Here’s an example response showing the cleaned tokens for title, description, and body fields:

    {
      "took": 2,
      "timed_out": false,
      "_shards": {
        "total": 5,
        "successful": 5,
        "failed": 0
      },
      "hits": {
        "total": 1,
        "max_score": 1,
        "hits": [
          {
            "_index": "html_poc_v3",
            "_type": "html_poc_type",
            "_id": "02",
            "_score": 1,
            "fields": {
              "title": [
                "Some",
                "Title",
                "déjà",
                "vu",
                "website"
              ],
              "body": [
                "Body",
                "Some",
                "déjà",
                "vu",
                "website"
              ],
              "description": [
                "a",
                "agrave",
                "d",
                "description",
                "eacute",
                "href",
                "http",
                "j",
                "p",
                "some",
                "somedomain.com",
                "vu",
                "website"
              ]
            }
          }
        ]
      }
    }

    Further Cleaning Elasticsearch Data References

    For additional resources, explore the following links:


    Conclusion

    Cleaning Elasticsearch data using custom analyzers and filters like html_strip ensures accurate and predictable indexing. By following the steps in this guide, you can avoid unwanted behavior and maintain clean, searchable data. Use the provided resources to further enhance your Elasticsearch workflow.

  • Git Alias Configuration: Work Smarter, Not Harder

    Git Alias Configuration: Work Smarter, Not Harder

    Git is an indispensable tool for developers, but typing repetitive commands can slow you down. With Git aliases, you can create short and intuitive commands to streamline your workflow.

    Here’s how to configure your Git aliases for maximum efficiency.


    Step 1: Edit Your .gitconfig File

    Your .gitconfig file is typically located in your $HOME directory. Open it using your favorite editor:

    vim ~/.gitconfig

    Step 2: Add Basic Git Configurations

    Here’s an example of what your .gitconfig might look like:

    [core]
        excludesfile = /Users/moses.mansaray/.gitignore_global
        autocrlf = input
    
    [user]
        name = moses.mansaray
        email = moses.mansaray@domain.com
    
    [push]
        default = simple

    Step 3: Add Useful Git Aliases

    Below are some handy Git aliases to boost your productivity:

    [alias]
        # Shortcuts for common commands
        co = checkout
        cob = checkout -b
        cod = checkout develop
        ci = commit
        st = status
    
        # Save all changes with a single command
        save = "!git add -A && git commit -m"
    
        # Reset commands
        rhhard-1 = reset --hard HEAD~1
        rhhard-o = reset head --hard
    
        # View logs in various formats
        hist = log --pretty=format:\"%h %ad | %s%d [%an]\" --graph --date=short
        llf = log --pretty=format:\"%C(yellow)%h%C(red)%d%C(reset)%s%C(blue) [%cn]\" --decorate --numstat
        lld = log --pretty=format:\"%C(yellow)%h %ad%C(red)%d%C(reset)%s%C(blue) [%cn]\" --decorate --date=short
    
        # View file details
        type = cat-file -t
        dump = cat-file -p
    
        # Amend commits easily
        amend = commit -a --amend

    Alias Highlights

    1. Branch Management:
      • co: Checkout an existing branch.
      • cob: Create and switch to a new branch.
      • cod: Switch to the develop branch.
    2. Commit Management:
      • ci: Shortcut for git commit.
      • save: Adds all changes and commits with a single command.
    3. Reset Commands:
      • rhhard-1: Resets to the previous commit (HEAD~1).
      • rhhard-o: Resets the current head completely.
    4. Log Views:
      • hist: Visualize commit history in a graph with formatted output.
      • llf and lld: View logs with decorations and detailed information.
    5. File Details:
      • type and dump: Inspect Git objects in detail.
    6. Quick Fixes:
      • amend: Quickly modify the most recent commit.

    Step 4: Test Your Aliases

    After saving your .gitconfig file, test your new aliases in the terminal:

    git st    # Check status
    git cob feature/new-feature  # Create and switch to a new branch
    git hist  # View the commit history

    Conclusion

    With your aliases set, you now have a simple yet powerful way to save time and reduce errors in your Git workflow. Enjoy turning repetitive tasks into one-liners.

    Do you have a favourite Git alias that isn’t on this list? Share it in the comments below!

  • The Case of Missing Elasticsearch Logs: A Midnight Mystery

    The Case of Missing Elasticsearch Logs: A Midnight Mystery

    While debugging my Elasticsearch instance, I noticed a curious issue: logs would vanish consistently at midnight. No logs appeared between 23:40:00 and 00:00:05, leaving an unexplained gap. This guide walks through the debugging process, root cause identification, and a simple fix.

    Initial Investigation: Where Did the Logs Go?

    At first glance, the following possibilities seemed likely:

    1. Log Rotation: Elasticsearch rotates its logs at midnight. Could this process be causing the missing lines?
    2. Marvel Indices: Marvel creates daily indices at midnight. Could this interfere with log generation?

    Neither explained the issue upon closer inspection, so I dug deeper.

    The Real Culprit: Log4j and DailyRollingFileAppender

    The issue turned out to be related to Log4j. Elasticsearch uses Log4j for logging, but instead of a traditional log4j.properties file, it employs a translated YAML configuration. After reviewing the logging configuration, I found the culprit: DailyRollingFileAppender.

    What’s Wrong with DailyRollingFileAppender?

    The DailyRollingFileAppender class extends Log4j’s FileAppender but introduces a major flaw—it synchronizes file rolling at user-defined intervals, which can cause:

    • Data Loss: Logs might not be written during the rolling process.
    • Synchronization Issues: Overlap between log files leads to missing data.

    This behavior is well-documented in the Apache DailyRollingFileAppender documentation.

    Root Cause: Why Were Logs Missing?

    The missing logs were a direct result of using DailyRollingFileAppender, which failed to properly handle log rotation at midnight. This caused gaps in logging during the critical period when the file was being rolled over.

    The Fix: Switch to RollingFileAppender

    To resolve this, I replaced DailyRollingFileAppender with RollingFileAppender, which rolls logs based on file size rather than a specific time. This eliminates the synchronization issues associated with the daily rolling behavior.

    Updated YAML Configuration

    Here’s how I updated the configuration:

    file:
      type: rollingfile
      file: ${path.logs}/${cluster.name}.log
      maxFileSize: 100MB
      maxBackupIndex: 10
      layout:
        type: pattern
        conversionPattern: "[%d{ISO8601}][%-5p][%-25c] %m%n" 

    Key Changes:

    • Type: Changed from dailyRollingFile to rollingFile.
    • File Size Limit: Set maxFileSize to 100MB.
    • Backup: Retain up to 10 backup log files.
    • Removed Date Pattern: Eliminated the problematic datePattern field used by DailyRollingFileAppender.

    Happy Ending: Logs Restored

    After implementing the fix, Elasticsearch logs stopped disappearing. Interestingly, further investigation revealed that the midnight log gap was also related to Marvel indices transitioning into a new day. This caused brief latency as new indices were created for shards and replicas.

    Lessons Learned

    1. Understand Your Tools: Familiarity with Log4j’s appenders helped identify the issue quickly.
    2. Avoid Deprecated Features: DailyRollingFileAppender is prone to issues—switch to RollingFileAppender for modern setups.
    3. Analyze Related Systems: The Marvel index creation provided additional context for the midnight timing.

    Conclusion

    Debugging missing Elasticsearch logs required diving into the logging configuration and understanding how appenders handle file rolling. By switching to RollingFileAppender, I resolved the synchronisation issues and restored the missing logs.

    If you’re experiencing similar issues, check your logging configuration and avoid using DailyRollingFileAppender in favor of RollingFileAppender. This can save hours of debugging in the future.

    For more insights, explore Log4j Appender Documentation.

    Also, to learn how to clean data coming into Elasticsearch see Cleaning Elasticsearch Data Before Indexing.

  • Lean Maven Release: The Maven Release Plugin on Steroids

    Lean Maven Release: The Maven Release Plugin on Steroids

    If you’ve ever been frustrated by the inefficiencies of the Maven Release Plugin—multiple builds, unnecessary commits, and endless waiting—you’re not alone. Enter the Lean Maven Release, a streamlined alternative to automate and optimize your Maven release process.

    This method eliminates repetitive steps, reduces build times, and minimizes interactions with SCM (Source Control Management). Let’s break it down.


    Why Choose Lean Maven Release?

    The Lean Maven Release strategy replaces the repetitive steps of the Maven Release Plugin with a more efficient, scriptable process. Instead of multiple check-ins to SCM and redundant builds, you can reduce the process to just four commands:

    mvn clean
    mvn versions:set
    mvn deploy
    mvn scm:tag 

    This approach can be set up in both Jenkins and TeamCity, saving hours for teams practicing Continuous Delivery or working in environments with frequent build requirements.

    Benefits of Lean Maven Release

    How much of an improvement can you expect? Let’s compare the two approaches:

    StepLean Maven ReleaseMaven Release Plugin
    Clean/Compile/Test Cycle13
    POM Transformations02
    SCM Commits02
    SCM Revisions1 (binary tag)3

    The difference is clear: Lean Maven Release significantly reduces overhead and complexity.


    Getting Started

    Here’s how to implement the Lean Maven Release process in your project:


    1. Add Required Maven Properties

    Ensure the necessary Maven plugin versions are defined in your pom.xml:

    <properties>
        <maven.compiler.plugin.version>3.1</maven.compiler.plugin.version>
        <maven.release.plugin.version>2.5</maven.release.plugin.version>
        <maven.source.plugin.version>2.2.1</maven.source.plugin.version>
        <maven.javadoc.plugin.version>2.9.1</maven.javadoc.plugin.version>
        <maven.gpg.plugin.version>1.5</maven.gpg.plugin.version>
    </properties> 

    2. Configure Deployment Paths

    Set up local or remote deployment paths in the <distributionManagement> section of your pom.xml:

    Local Deployment Example:

    <distributionManagement>
        <repository>
            <id>internal.repo</id>
            <name>Internal Repo</name>
            <url>file:///${user.home}/.m2/repository/internal.local</url>
        </repository>
    </distributionManagement> 
    <distributionManagement>
        <repository>
            <uniqueVersion>false</uniqueVersion>
            <id>corp1</id>
            <name>Corporate Repository</name>
            <url>scp://repo/maven2</url>
            <layout>default</layout>
        </repository>
    </distributionManagement> 

    3. Add Maven Plugins

    Add the necessary Maven plugins to your pom.xml:

    <build>
        <pluginManagement>
            <plugins>
                <plugin>
                    <groupId>org.apache.maven.plugins</groupId>
                    <artifactId>maven-compiler-plugin</artifactId>
                    <version>${maven.compiler.plugin.version}</version>
                </plugin>
                <plugin>
                    <groupId>org.apache.maven.plugins</groupId>
                    <artifactId>maven-release-plugin</artifactId>
                    <version>${maven.release.plugin.version}</version>
                    <configuration>
                        <useReleaseProfile>false</useReleaseProfile>
                        <releaseProfiles>release</releaseProfiles>
                        <goals>deploy</goals>
                    </configuration>
                </plugin>
                <plugin>
                    <groupId>org.apache.maven.plugins</groupId>
                    <artifactId>maven-source-plugin</artifactId>
                    <version>${maven.source.plugin.version}</version>
                </plugin>
                <plugin>
                    <groupId>org.apache.maven.plugins</groupId>
                    <artifactId>maven-javadoc-plugin</artifactId>
                    <version>${maven.javadoc.plugin.version}</version>
                </plugin>
                <plugin>
                    <groupId>org.apache.maven.plugins</groupId>
                    <artifactId>maven-gpg-plugin</artifactId>
                    <version>${maven.gpg.plugin.version}</version>
                </plugin>
            </plugins>
        </pluginManagement>
    </build> 

    4. Define the Release Profile

    Include a release profile to configure the Maven deployment process:

    <profiles>
        <profile>
            <id>release</id>
            <properties>
                <activatedProperties>release</activatedProperties>
            </properties>
            <build>
                <plugins>
                    <plugin>
                        <groupId>org.apache.maven.plugins</groupId>
                        <artifactId>maven-source-plugin</artifactId>
                        <executions>
                            <execution>
                                <id>attach-sources</id>
                                <goals>
                                    <goal>jar</goal>
                                </goals>
                            </execution>
                        </executions>
                    </plugin>
                    <plugin>
                        <groupId>org.apache.maven.plugins</groupId>
                        <artifactId>maven-javadoc-plugin</artifactId>
                        <executions>
                            <execution>
                                <id>attach-javadocs</id>
                                <goals>
                                    <goal>jar</goal>
                                </goals>
                            </execution>
                        </executions>
                    </plugin>
                </plugins>
            </build>
        </profile>
    </profiles> 

    5. Optional: Configure Assembly Plugin

    If required, add an assembly descriptor for packaging:

    <assembly>
        <id>plugin</id>
        <formats>
            <format>zip</format>
        </formats>
        <includeBaseDirectory>false</includeBaseDirectory>
        <dependencySets>
            <dependencySet>
                <outputDirectory>/</outputDirectory>
                <useProjectArtifact>true</useProjectArtifact>
                <useTransitiveFiltering>true</useTransitiveFiltering>
            </dependencySet>
        </dependencySets>
    </assembly> 

    6. Skip GPG Signing (Optional)

    If you don’t want to sign packages, you can skip the GPG plugin during deployment:

    mvn deploy -Prelease -Dgpg.skip=true 

    Conclusion

    This Lean Maven Release approach allows you to:

    • Eliminate unnecessary SCM interactions.
    • Reduce build times significantly.
    • Simplify deployment workflows.

    This method is ideal for teams practicing Continuous Delivery(CD) or dealing with frequent release cycles. For more details, check out Axel Fontaine’s blog post, which inspired this guide.

    Let me know what you think!

  • IntelliJ Tweaks: Hot Deploy/Swap to Servlet Server

    IntelliJ Tweaks: Hot Deploy/Swap to Servlet Server

    IntelliJ Tweaks: Hot Deploy/Swap to Servlet Server

    Hot deployment in IntelliJ IDEA allows developers to make changes to their code and immediately see the results on the Servlet Server without restarting the application. This tweak is a lifesaver for anyone working in a fast-paced development environment.

    Follow these simple steps to enable Hot Deploy and Hot Swap in IntelliJ IDEA.

    Steps to Enable Hot Deploy

    1. Update Debugger Settings

    Go to:

    File → Settings → Debugger → HotSwap
    • Enable class reload on the background: Set to true.
    • Enable class reload after compilations: Set to always.

    2. Configure Run/Debug Settings

    Update your Run/Debug Configuration:

    • In the “On frame deactivation” dropdown, select “Update resources.”

    Bonus: More Configuration Tips

    For advanced hot deployment scenarios, refer to this detailed guide on Hot Deployment with IntelliJ IDEA.

    Conclusion

    You’ll spend less time restarting your server and more time focusing on building your application after these IntelliJ tweaks. Hot deployment can significantly improve productivity, especially in projects where frequent updates are necessary.

    Try it out and let the rapid feedback loop supercharge your development workflow!